Material flow simulation using Plant Simulation
Use case for carrying out a material flow simulation in Plant Simulation
Target definition of the material flow simulation
At the beginning of a material flow simulation, the objectives to be achieved and the desired results should always be defined. As a result, the choice of software program for creating the material flow simulation is also made. In principle, many different tools are suitable, such as visTABLE. For the use case, the Plant Simulation program from Siemens was selected, as it has the ability to create a digital twin using state-of-the-art technology and provides a wide range of analysis tools. Furthermore, the software’s own SimTalk language enables the programming of methods that allow the digital model to be built up in customer-specific detail.
Simulation of throughput time in Plant Simulation
Using a throughput time optimization for a production station, we will show you how to carry out a material flow simulation with Plant Simulation. Within production, a total of five different products are manufactured on four machines. An analysis or assessment of the current situation should identify the bottleneck that is responsible for high throughput times. Subsequent optimization should eliminate this bottleneck. As in the classic material flow analysis, an ACTUAL model of the current material flow must first be created. This can then be used to carry out the subsequent optimization. When using a digital model as a tool, this represents the model of the current state.


What are the components of a material flow simulation in Plant Simulation?
Based on the objectives and data, the material flow simulation can be realized in Plant Simulation. The model for production contains the following components:
- Tables for configuring the twin
- Sankey diagrams
- Histogram for displaying throughput times
- Sub-networks to represent the transport routes
- Machines
- Sub-networks for experiments and methods
- Visual display for the number of processed products
Evaluation & presentation of the data
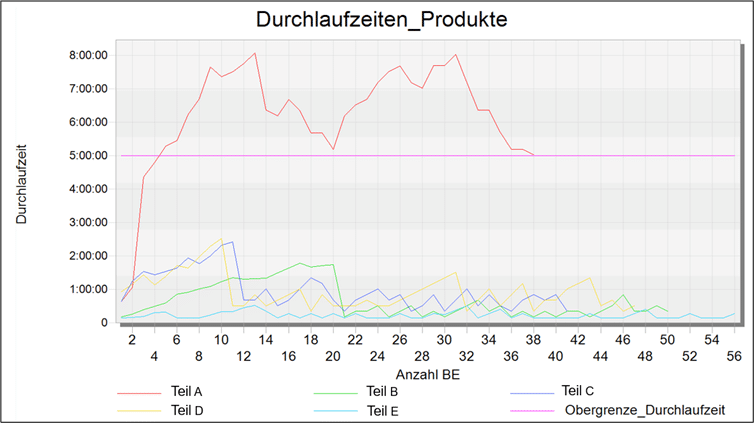
The digital model is used for material flow simulation, evaluation and data visualization. Plant Simulation offers various tools for this purpose. These can be dynamic or static. A histogram is implemented for analysis, which dynamically records and displays the throughput times of the individual products. The flow is displayed visually using a Sankey diagram. The illustration only shows the flow of the product “Part A” as an example.


Assessment & weak point analysis
Based on previously defined key figures and assessment criteria, a weak point analysis is carried out to identify the bottlenecks. When looking at the histogram and the Sankey diagrams, it becomes clear that “Part A” clearly exceeds the limit for the maximum throughput time. According to the analysis, the reason for this is that the delivery times for the raw parts are too short and there are too few parallel stations, which results in waiting times during processing. A total of three products are manufactured in machine 1. This shows the potential of material flow simulation.
Optimization of the material flow in Plant Simulation
The finished actual model is then used to simulate the material flow and create a target model, which can then be implemented. Here, not only the findings from the weak point analysis are incorporated, but also your customer requirements. This material flow simulation in Plant Simulation can be divided into rough and detailed planning.

Using experiments to iteratively achieve the optimum material flow
Based on the previously defined objectives of the material flow simulation, an attempt is made to develop an ideal concept that can be finalized in the subsequent detailed planning. It should be noted here that restrictions of all kinds are not initially taken into account. The simulation offers the possibility of efficiently implementing the necessary changes and thus creating as many concepts as possible in a short time. For mechanical production, no parallel stations are considered due to lack of space and only attempts are made to optimize delivery times. Plant Simulation offers the possibility to configure experiments in order to find the optimal delivery time. The illustration shows the result of the experiments, whereby a maximum delivery time between 7:30 min and 8:00 min emerges.
Result of the material flow simulation in Plant Simulation
During detailed planning, the results of the rough planning are used to work on a real solution that takes all restrictions into account. After the material flow simulation in Plant Simulation, all precautions are taken to enable implementation. For mechanical production, all delivery schedules are adjusted so that the raw parts only arrive in production every 8:00 minutes at most.
